When designing your supply chain, proximity matters. For both B2B and B2C firms, it is vital to consider how far your Distribution Centers (DCs) are from your customer base, and what impact that distance has upon service level and operational cost. For example,
- Grocers may locate their temp-controlled Distribution Centers within a day’s drive from all stores, to ensure food freshness
- E-commerce retailers may guarantee two-day shipping to all customers, and thus locate Fulfillment Centers considering this promise
But how do we select locations for our Distribution Centers that meet these goals? First off, we need to know the driving distances from our potential DCs, to our customers.
This poses a problem. It is prohibitively difficult to find the driving distance from all possible DC locations, to all possible customer locations. For most firms, it would be impractical to use a service like Google Maps to find the driving distance and time for all DC-customer pairs under consideration.
In supply chain design, we often get around this real-life complication through approximation. Given the latitude and longitude of an origin and destination, computers can quickly and easily calculate find the straight-line distance (“as the crow flies”) between the two points.
(For the interested, this calculation involves trigonometry. If you can time-travel, go back and tell your 10th-grade self that yes, you will use this someday. Then thank your math teacher. Then use your summer job money to go all-in on Bitcoin or, if you’re middle aged or older, some kind of fruit company.)
You then tack on an extra 15% or so – often called a “circuity factor” – to the straight-line distance, and the result will generally be pretty close to the actual driving distance. This approximation allows you to very quickly establish how much of the country can be reached from your Distribution Centers within a certain driving time.
For example, suppose our planning factor is that a truckload driver can drive for 600 miles a day. With a 15% circuity factor (meaning that the road distance from A to B is 15% longer than the straight-line distance from A to B), we can solve with some Algebra 101:
x Road Miles = y Straight-Line Miles x (100% + 15% Circuity Factor)
600 Road Miles = (y Straight-Line Miles) x 1.15
600/1.15 = 521.74 Straight-Line Miles
So if our planning factor is 600 road miles a day, we can draw a circle on the map around our potential DC locations with a radius of 521.74 miles. The points on the map that fall within that circle are approximately reachable within a day.
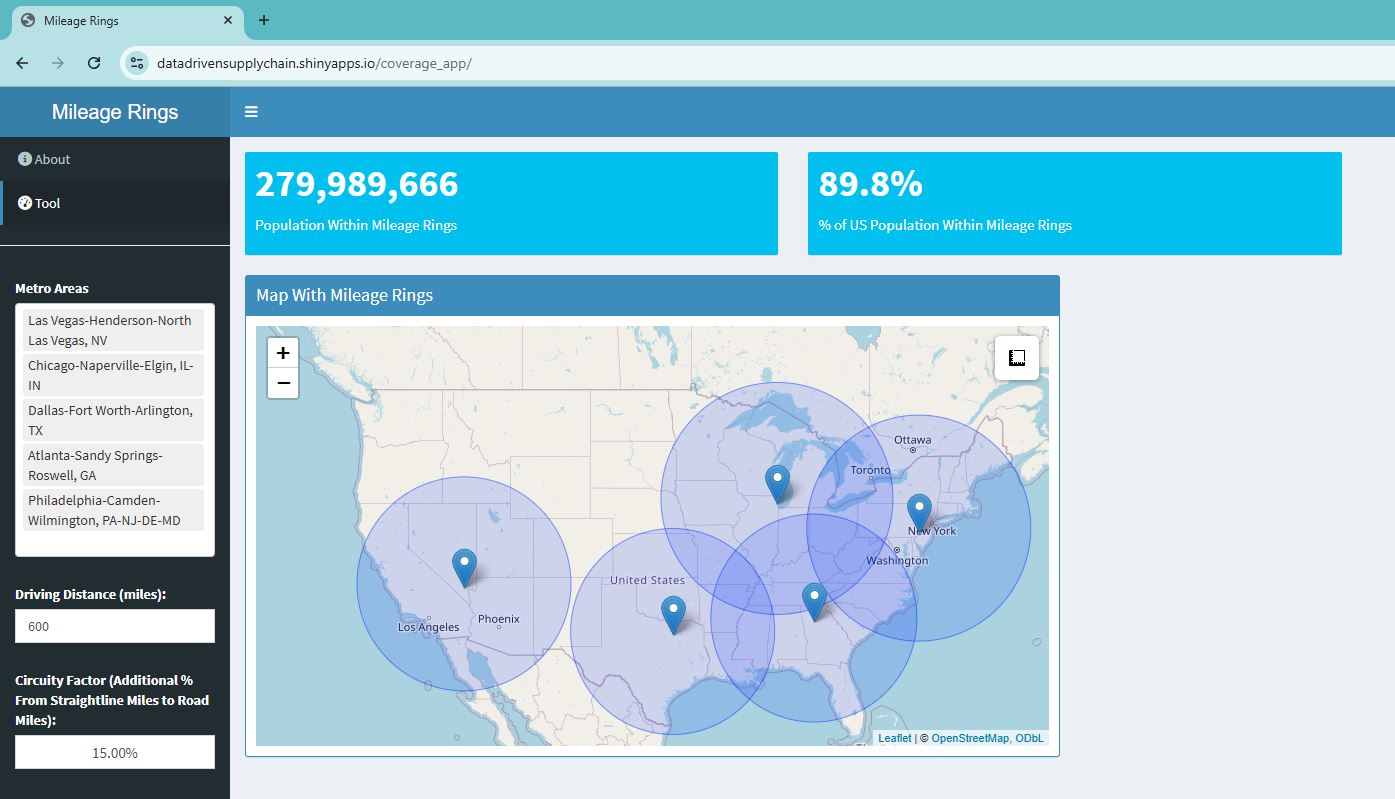
Suppose we are a grocery store chain and are totally reimagining our distribution footprint. Executive guidance is to cover as much of the United States as possible within one day’s drive, without over-investing in Distribution Centers. A working group suggests that we look at building five DCs: in Las Vegas, Chicago, Dallas, Atlanta, and Philadelphia.
The circles on this map, with radius 521.74 miles around each of the five Distribution Centers, show how much of the United States can be reached within a one-day drive from at least one of our DCs. The covered areas represent about 90% of the population. Not bad!
(Try the app out yourself here. Instructions are in the About tab.)
Apps like these work well when we have a starting hypothesis, like which five cities we want to place our Distribution Centers into. But what if we have only starting guidance – like at least 95% of the country covered within a day’s drive from our DCs? This is where optimization, the math underlying supply chain design software, shines.
After building an optimization model in an open-source programming language like Python or R, we provide the model:
- A list of candidate DC locations, like the 50 top metro areas listed above.
- Maximum driving distance from the DCs (like 600 road miles, representing a day’s drive)
- Circuity Factors
The model will then provide a list of Distribution Centers (really, metro areas) that will provide 95% coverage within a day’s drive, while minimizing the total number of buildings. Our model suggests we build DCs in New York, Seattle, Las Vegas, Jacksonville FL, Milwaukee, and Oklahoma City:
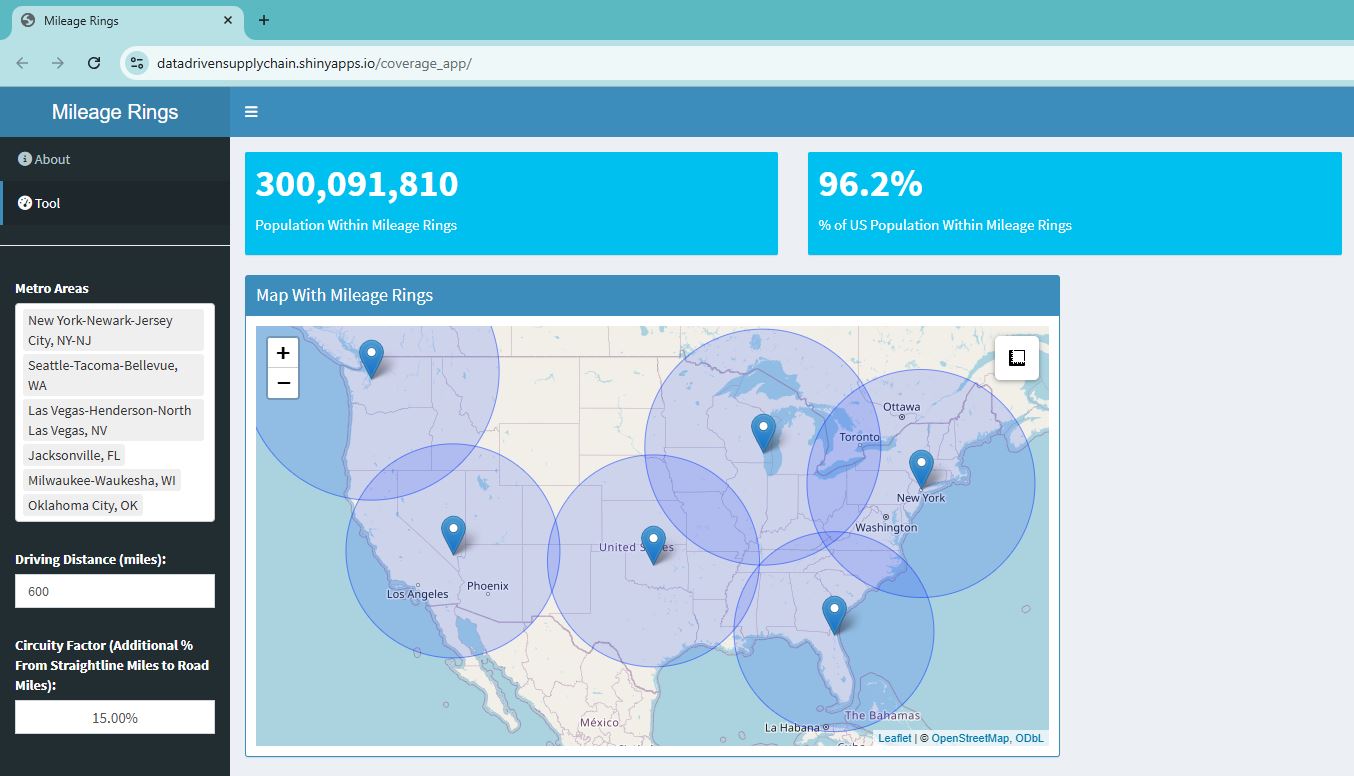
It’s important to note that these may not be the only possible list of 6 DCs that provide the 95% coverage within a day’s drive. And this coverage model is fairly simplistic, as it does not include costs or capacity constraints at DCs. Still, it’s a good starting point for discussions and can lead to more comprehensive supply chain design models, with important inputs like costs and capacity constraints.
In an upcoming post, we will move from national-level supply chains to hyperlocal supply chains. How does this approach differ when we’re talking about thirty minute delivery, not one day delivery?
To learn more about our supply chain design consulting, read case studies or contact us.
To receive content like this and other updates from Data Driven Supply Chain, sign up here. You can unsubscribe at any time.