Our recent Thanksgiving dinner included a 19-pound roasted turkey. We ate about one-third of the turkey and refrigerated the remainder, as the Pilgrims did so long ago. On Black Friday, my stepmother returned from a trip to the grocery store and remarked that whole turkeys – already quite affordable before the holiday – were now deeply discounted.
Turkeys are heavily discounted right after Thanksgiving because with the holiday past, frozen turkey sales drop off a cliff and stores need to get rid of the turkeys before they spoil. (Perhaps JD Vance was onto something.)
Ideally, grocery stores will not have hundreds of pounds of frozen turkeys to sell on Black Friday at deep discount. Ideally, they will sell their very last frozen turkey to a panicked, sweatpants-clad, first-time Thanksgiving host right before store close on Blackout Wednesday as said host Googles how long defrost turkey forgot.
But clearly that doesn’t happen, and there’s excess inventory of frozen turkeys. So how to plan for purchasing frozen turkeys – or any other perishable SKU?
To answer this question, let’s turn from frozen turkeys – a product strongly associated, in the United States, with a single holiday and its associated demand spike. Instead, let’s discuss fresh donuts, something that nearly everyone enjoys, at least occasionally. (Except, perhaps, JD Vance).
It’s Winter, Let’s Do Donuts
The 24-hour grocery store near my home sells several varieties of fresh donuts, baked in-house daily. I’ve been in this store at all hours – from early morning, when the donut trays are fresh and full and sugar fills the air, to very late at night, when only the most undesired donut varieties remain, becoming the consistency of powdered rocks.
Ideally, the grocery store’s bakery will make enough donuts so that each day’s supply exactly matches its demand. That is, all donut varieties will sell out just an instant before the next day’s batch is put in the display.
That way, there would be no excess, unsold donuts; and no early sellouts: nobody would arrive at the donut display to see empty racks where their chocolate cake rings should be, their hanger unabated.
So how many donuts should the grocery store bake each day so that they are neither selling out prematurely (with unfulfilled customer demand) nor having unsold inventory at the end of the day?
Extra, Extra, Read All About It
To answer this, we need to look back at a media technology of yore: a printed newspaper.
In operations management, the newsvendor model is an inventory management model that answers the question: what is the optimal stocking quantity of a perishable item?
It takes its name from a newsstand. At the beginning of the day, the newsvendor has to decide how many of today’s newspapers to purchase from the publisher, for sale on the newsstand. Buy too few, and you’ll run out – leading to lost profits and potentially upset customers. Buy too many, and you’ll have unsold newspapers at the end of the day. Barring history-changing events, those newspapers aren’t worth much, and the newsvendor will lose money on each unsold copy.
When you start to look, you see newsvendor models everywhere: nearly any product that, after a certain date, cannot be sold at full price; and whose daily or weekly demand is uncertain. Examples include:
- Highly perishable food: meat, dairy, vegetables, bakery
- Fresh-cut flowers
- Seasonal items: Halloween costumes, Christmas decorations, movie tie-ins
- Halloween candy
- Tickets for concerts, sports, and commercial flights (after the event ends or the plane takes off, tickets can’t be sold)
- And yes, newspapers! (and magazines)
To determine the optimal quantity to stock at the beginning of the day or week, you need to determine:
- The cost of understocking by one unit of demand: typically forsaken profit
- The cost of overstocking by one unit of demand: typically the unit cost, minus any salvage value
Time To Make the Donuts
So back to our donuts example. The grocery store sells them for $1.25 each. Let’s say that they cost, on average, $0.75 each to produce. Any unsold donuts can be sold the next day at a loss, selling for $0.50 each.
The daily sales demand follows a bell curve (a normal distribution), as many high-selling items do, with an average of 30 donuts and a standard deviation of 5 donuts.
Calculating our inputs:
- The cost of understocking by one unit of demand (forsaken profit): $1.25 sale price – $0.75 production cost = $0.50
- The cost of overstocking by one unit of demand (unit loss): $0.75 production cost – $0.50 next-day-sale price = $0.25
Now, we need a little math… but just a little.
First, we calculate the Critical Ratio: (Cost of Understocking) / (Cost of Understocking + Cost of Overstocking)
Critical Ratio = $0.50/($0.50 + $0.25) = 0.50/0.75 = 66.67%
Now, we need to find the number of donuts to stock such that we will have enough on 66.67% of days, or roughly 67 out of 100. In Excel, this is easy:
- NORM.INV( Critical Ratio, Average Daily Sales, Standard Deviation of Daily Sales)
- with values: NORM.INV(0.50/0.75, 30, 5) = 32.15, round to 32 donuts
32 donuts is the right number to stock to maximize the financial return on the donut sales. Note that this means we’ll run out of donuts on roughly 1 out of 3 days!
Simulating Your Decision
Simulation is what-if analysis cranked to 11. Simulation allows us to look at the range of potential outcomes of a decision, rather than just a single number. If we start every day with 32 donuts, there will be some days where demand exactly equals 32: perfection. There will be some days where demand is low and we have unsold product at the end of the day. There will be other days where demand is high, we sell out early, and we have unhappy customers.
Simulation allows us to see that range of outcomes and confirm that the production quantity suggested by the newsvendor model, is truly optimal financially. This happens by simulating a large number of days’ demand, seeing how the financials shake out on each day, and aggregating the results.
In this newsvendor model simulation app, we input the newsvendor model parameters (pre-set for this example – but please experiment with other settings!)
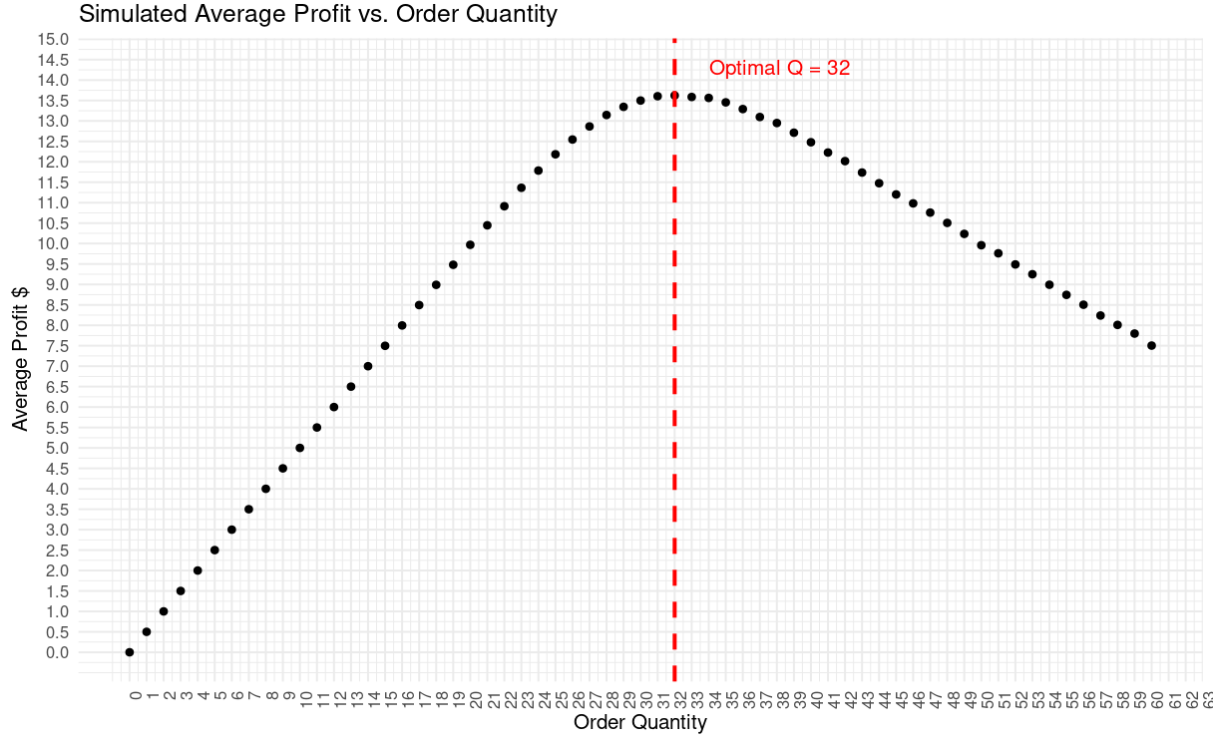
The app simulates what would happen at different stocking quantities, ranging from zero donuts (not a good idea!) to sixty donuts. For each of those stocking quantities, the app simulates 50,000 days’ demand (some very low, some very high, and everything in between) – and records that day’s profits.
The app then averages those profits and displays it on the y-axis. For example, starting the day with 10 donuts yields an average daily profit of $5.
Starting at zero donuts and increasing our production quantity, we see that profit rises: up to a certain point, we’re nearly guaranteed to sell out, so we should have more inventory and get incremental profit.
This benefit peaks at 32 donuts – a little more than the average demand – with about $13.50 in average daily profit. Once we get past 32 donuts, we have more and more unsold donuts, hurting our profit. So the simulation supports our calculated value of 32 donuts as the optimal number of donuts to produce each morning.
For an in-depth case study on using simulation to optimize your inventory, click here.
Conclusion
For highly perishable products, deciding how much inventory to buy or produce is a tough balancing act. You don’t want to buy too much and have excess inventory to get rid of, or too little, and risk losing out on profit and potentially upsetting customers. Using a newsvendor model to determine optimal inventory levels is a great start to threading that needle.
To learn more about our consulting in supply chain design, inventory optimization, and demand forecasting, read case studies or contact us.
To train your team on inventory optimization, supply chain network design, and more, contact us. You can read about previous training sessions here and here.
To receive content like this and other updates from Data Driven Supply Chain, sign up here. You can unsubscribe at any time.