One of the best parts about having a background in applied math and statistics is that I see numbers in everyday life.
Waiting in the checkout line at a store, or anxious you’ll not get through TSA security in time? That’s just queueing theory in action.
Trying to figure out the most efficient route to drive for all your errands? Why, call up a traveling salesman for help. (Although, make sure they’re not in a Flannery O’Connor short story.)
This applies to board games also.
If you have small children, you know that simpler games are better. In a game night over the Christmas break, my 5-year-old picked a game that has 42 spaces in the “forward” direction, and 42 spaces in the “backwards” direction.
Players start in the middle. I mocked it up in Excel and gave each space a numeric designator, from -42 (furthest backwards) to +42 (furthest forwards). The start is designated as space zero. The goal is to advance your game piece to either the end of the forward spaces, or the end of the backwards spaces – to get to either space +42 or space -42.
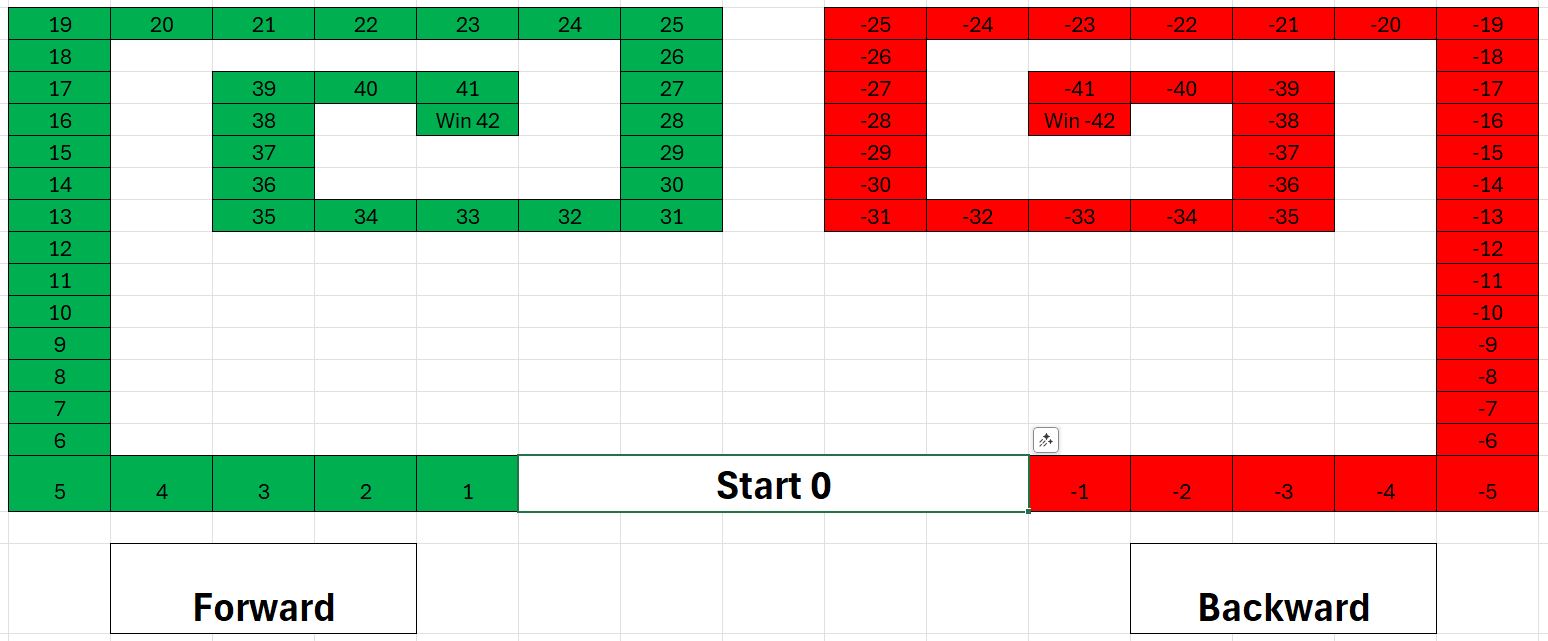
On their turn, a player:
- spins a spinner that determines the direction they will move (forward or backwards), with a 50% probability of each
- rolls two dice, the sum of which determines how far forward or backwards they will move their game piece
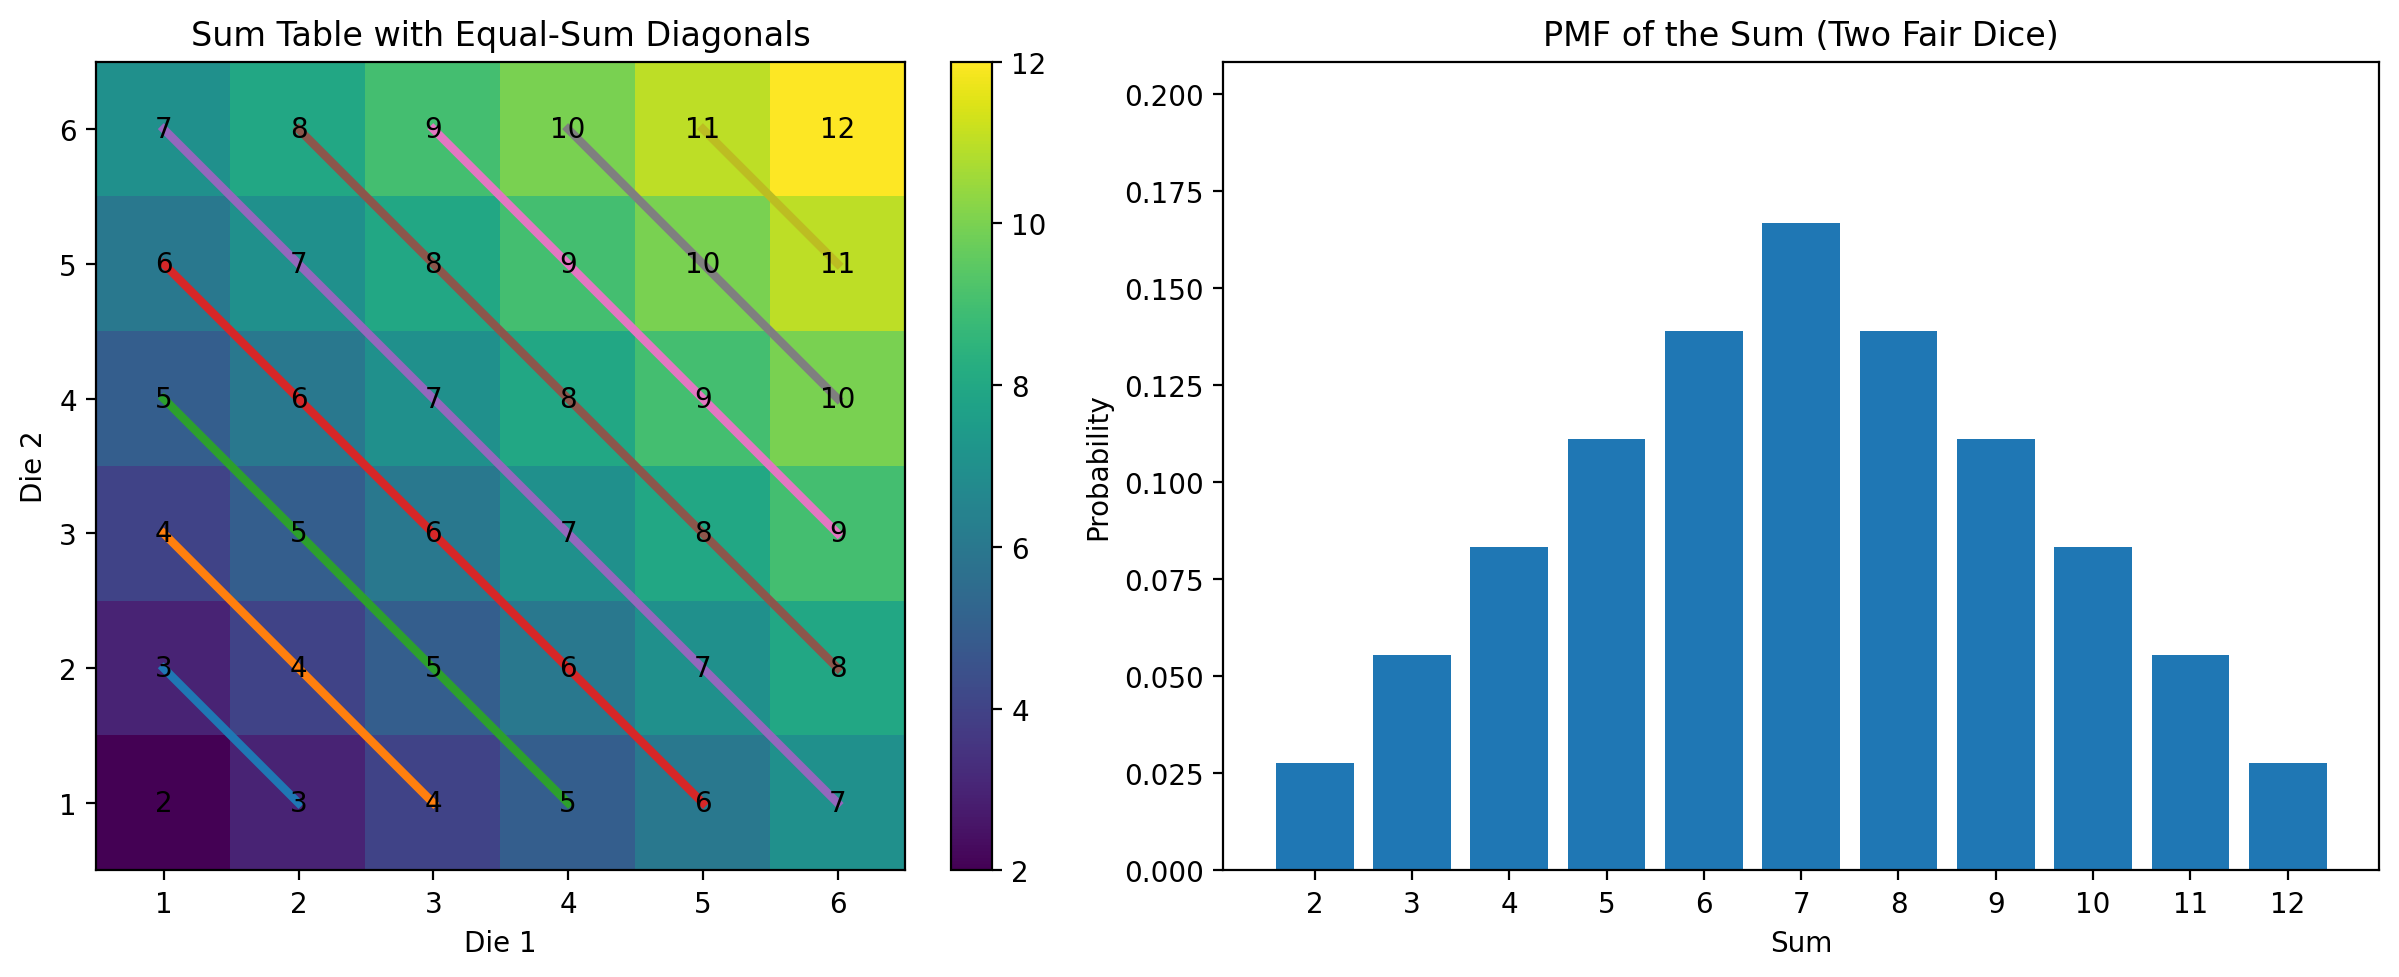
You may remember from intro statistics class that if you throw two dice, there are 36 potential combinations: six values on the first die, times six values on the second die, yields 36 unique permutations of values.
The sum of these dice range from two to twelve, but they’re not equally likely: throwing a sum of two (snake eyes) happens, on average, once out of every 36 throws (2.8%). Same for a sum of twelve (box cars).
A sum of seven, on the other hand, happens about once every six throws, because there are six different combinations of dice values that yield a sum of seven. The left image shows potential combinations of dice and their sum. The right image is a probability chart of each sum. It looks somewhat like a normal distribution (“bell curve”), with the extremely low and high values far less likely than the middle values.
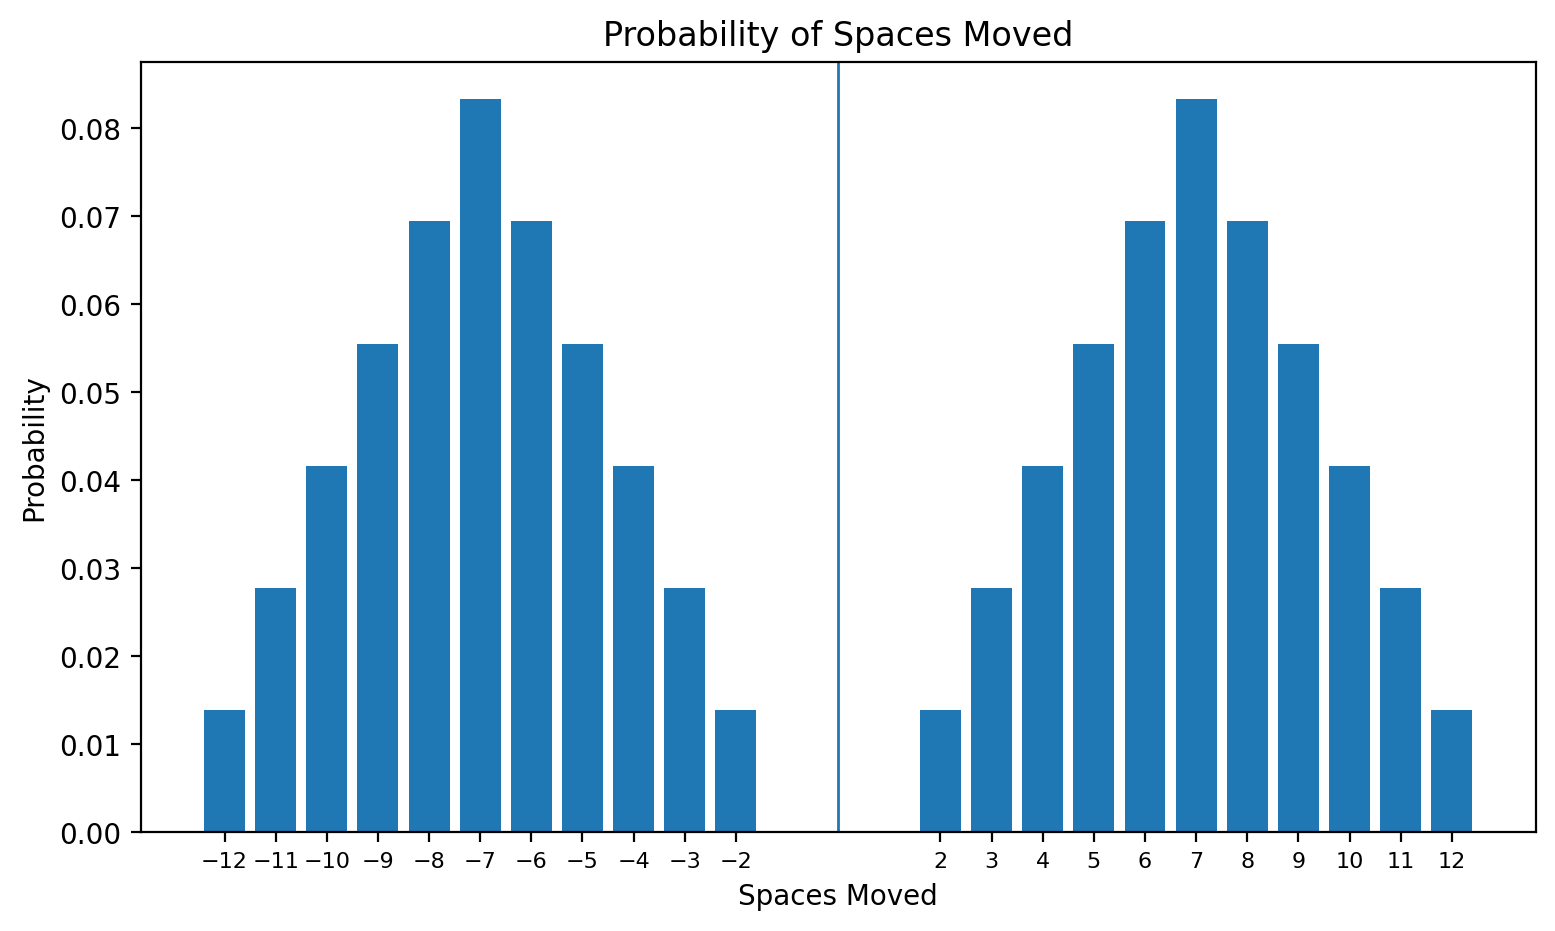
And since the player also spins whether to go forward or backwards, the probability distribution of how a player will move in a turn is just one-half those probabilities. Note that it’s impossible to move zero spaces, or just one space.
So back to the game. Theoretically, it could go on forever – all players can get really unlucky and just move their game piece back and forth until someone (parent or child) cries and we just end it. But how likely is this? How long should we expect this game to last?
You can either work out this probability problem, or just simulate it. Simulation is a way to take something that is inherently uncertain – a board game that depends entirely upon luck, or your customer’s buying patterns – and see how likely different outcomes are.
We can quickly write code that simulates this game: as many players as we want, and as many rolls as we want. Let’s first simulate a single game with four players. The code will simulate the rolls, and track each player’s game piece position backwards (negative values for the rolls) or forward (positive values for rolls).
With four players, a simulated game can look like this. The simulation shows each player independently until their board position reaches 42 or -42 (the winning positions, marked by green horizontal lines on the plot).
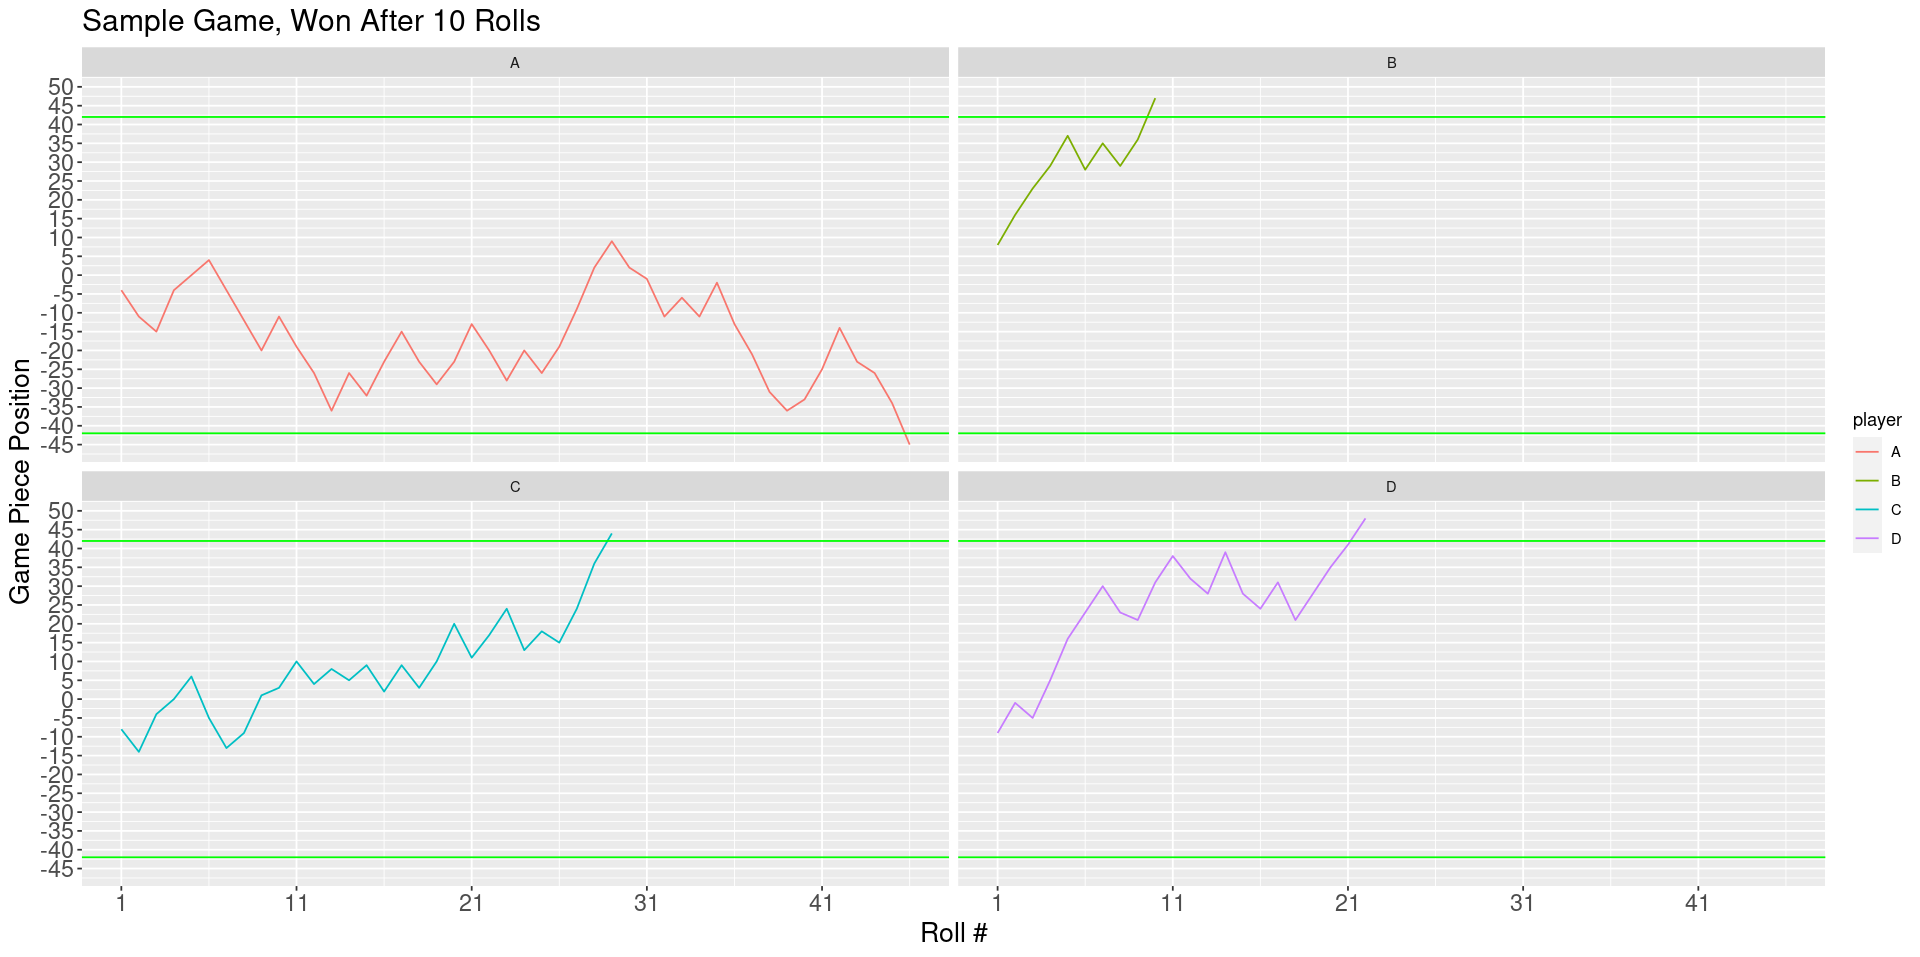
Player B (top right) reached +42 after only ten rolls, winning the game. If allowed to continue, Players A, C, and D reached +/- 42 after 46, 29, and 22 rolls, respectively.
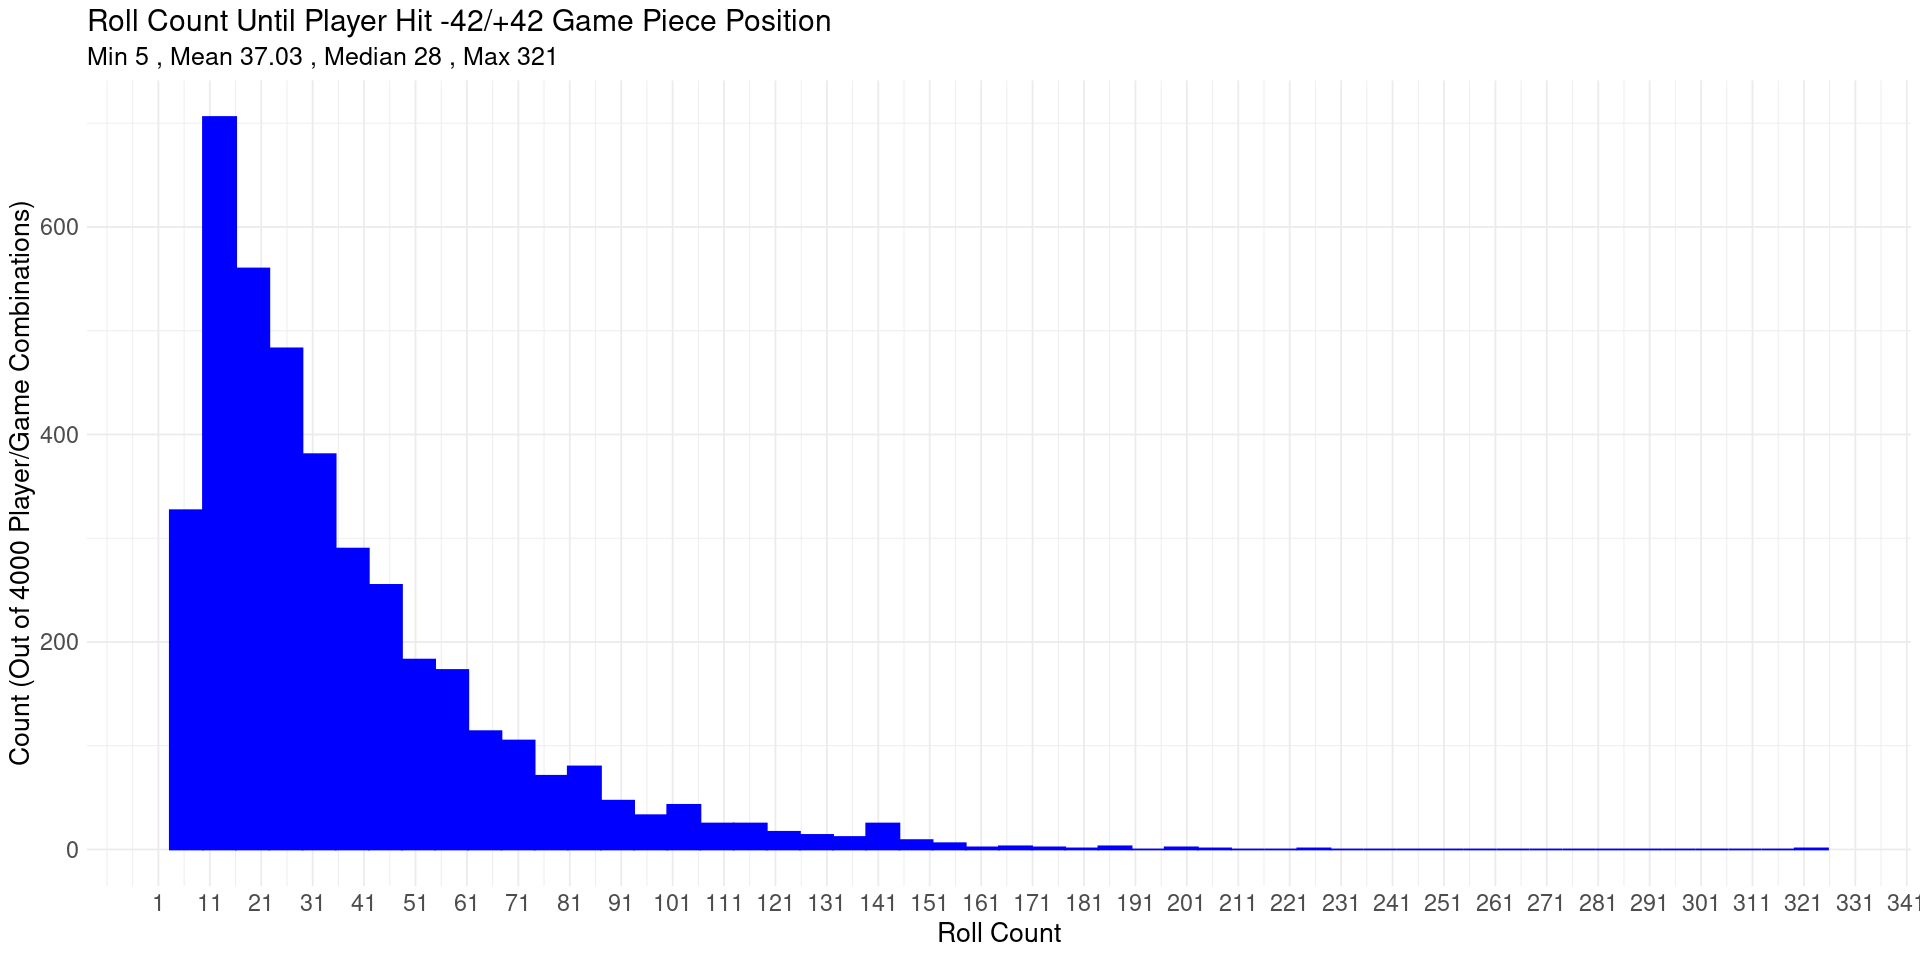
Repeating this over 1000 games, we then have 4000 combinations of players and games. Finding when they reached +/- 42 and plotting into a histogram, we find a minimum of five rolls, maximum of over 300 rolls, with an average of 37 and a median of 28. Remember that the median is the “halfway point” of a dataset: half of the roll counts were less than 28 and half more than 28.
Thankfully, we don’t have to play until everyone reaches +/- 42: the game stops when the first person reaches that point. So how long do we need to wait? Simulating the 1000 games with four players, we find an average of 14.36 turns for each player, a median of 13 turns for each player, and a merciful yet excruciating maximum of 53 turns:
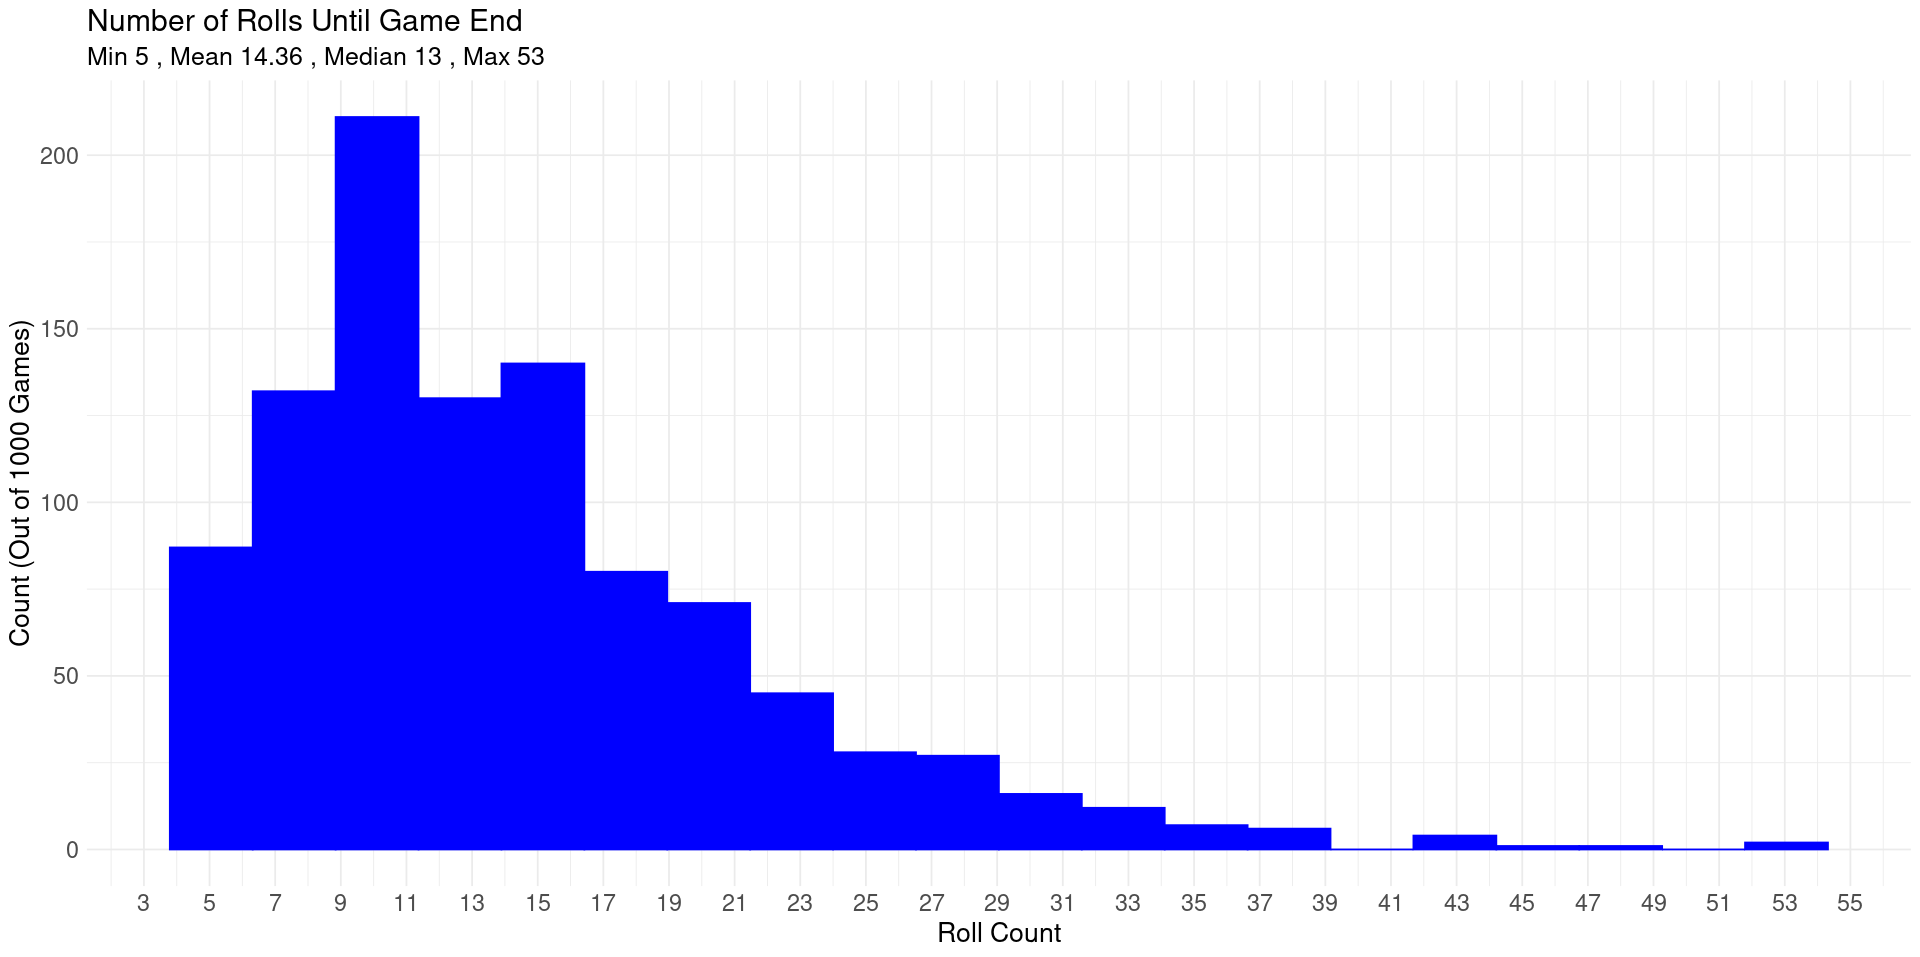
So there you go – with four players, you can reasonably expect to be done in about 25 turns or so.
(Note: I wrote this simulation in R and generated all graphics. Out of curiosity, I used natural language to pose the scenario to Claude AI and it generated almost exactly the same simulation results, whereas chatGPT just whiffed on it. Claude also gave a good explanation for the underlying probability theory, much of which I hadn’t worked with since grad school.)