How can defining goals for a metric actually make the metric worse?
When I was on military recruiting duty, we closely tracked how our applicants performed on the ASVAB, the military aptitude test. After an applicant completes the ASVAB, they receive their subtest scores, which are used for determining eligibility for specific military jobs, and their AFQT (Armed Forces Qualifying Test) score, an aggregate metric which is used to determine general eligibility to enlist.
Potential AFQT scores range from 1 to 99. For example, a 63 AFQT means you did better than 63% of a reference group – so higher is better. Applicants who score in the top half of the reference group – an AFQT of 50 or higher – are considered high-quality. Bringing in a high percentage of applicants with a 50+ AFQT is encouraged and rewarded; a floor percentage is enforced.
Goodhart’s Law states that “when a measure becomes a target, it ceases to be a good measure.” In recruiting, this bright line – where a 49 AFQT was considered dramatically worse than a 50 AFQT – led to some behaviors that, when looked at from a different perspective, didn’t always make sense.
For example, in one month:
- Recruiter Sergeant Jones enlists two applicants, one with a 50 AFQT and another with a 52 AFQT. The average would be a 51 AFQT, and both would be a 50+ AFQT: 100% for Sergeant Jones
- Recruiter Sergeant Smith also enlists two applicants, one with a 49 AFQT and another with a 93 AFQT. Though the average would be a 71 AFQT, much higher than Sergeant Jones, only one of them would be a 50+ AFQT: 50% for Sergeant Smith
This is an example of where a continuous metric, one where the values range from high to low, becomes a categorical metric, where a value on one side of a line is “good” and a slightly different value is “bad.” Even though arguably, Sergeant Smith is doing better by bringing in a higher average AFQT, Sergeant Jones has ensured both of his enlistees make it over the 50+ AFQT line. **
In the context of supply chain management, think of metrics like On-Time Percentage, Fill Rate, or On-Time In Full. If your goal is 95% to be “green,” there’s no categorical difference between 95% and 99% – they’re both above the threshold. There is less organizational incentive to get better than 95%. Even if getting to 99% would lead to hundreds of thousands of dollars in additional profit for your company, chasing that categorical metric means you’re more likely to stop once you get over the finish line of 95%.
Even worse, categorical metrics subtly equate near-misses with wildly unacceptable behavior. Suppose your truckloads are considered on-time if they arrive within 30 minutes of the appointment window. Arriving:
- 29 minutes late: on-time
- 30 minutes late: on-time
- 31 minutes late: not on-time
- 3 hours late: not on-time
The purpose of a good KPI is to provide actionable insight into your operations. A categorical metric that functionally equates “late by two minutes” with “late by multiple hours” is obscuring the true state of your supply chain – good, bad, or ugly.
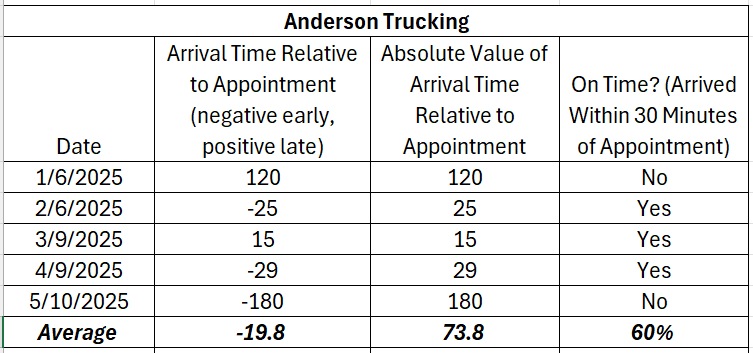
Consider two carriers, each with five appointments on identical days. Though each carrier made only 3 of 5 appointments – a very bad 60% – their individual behavior was very different. Anderson Trucking was, on average, about 20 minutes early for their appointment window, but this varied wildly from 3 hours early to 2 hours late, with an average absolute value of 73.8 minutes off the appointment time.
Darling Trucking, however, was much tighter. They were, on average, 3 minutes late for their appointment window, varying from 45 minutes early to 32 minutes late, with an average absolute value of 26.8 minutes off the appointment time – much better than Anderson. Who would you rather have carrying your loads?

Conclusion
Converting a continuous metric, like how early or late a truck arrives relative to its appointment time, into a categorical metric, like if it arrived within 30 minutes or not, obscures the truth of how your supply chain is operating.
To help combat these negative effects:
- Adjust your KPIs to reflect continuous values whenever possible
- Avoid overreliance on “red/yellow/green” thinking – it discourages continuous improvement
What other examples can you think of where using a categorical metric, like red/yellow/green, is worse than using the corresponding continuous metric directly?
** This doesn’t begin to address that the aptitude difference between an applicant who earned a 49 AFQT and an applicant who earned a 50 AFQT is marginal at best; and that an individual’s test performance can vary on any given day for multiple reasons.
To learn more about our consulting in supply chain design, inventory optimization, and demand forecasting, read case studies or contact us.
To train your team on inventory optimization, supply chain network design, and more, contact us. You can read about previous training sessions here and here.
To receive content like this and other updates from Data Driven Supply Chain, sign up here (email signup) or on Substack. You can unsubscribe at any time.