Hello Charlotte, NC supply chain professionals!
On the heels of August’s training in Minneapolis, “Supply Chain Analytics in R”, Jeff Clement, PhD and I are taking the show the road to Charlotte: Tuesday, January 30, 2024.
This training will include:
– Types of supply chain data
– Types of charts and graphs and when to use them
– Best practices in data visualization
– Data storytelling fundamentals
– Maps and animations: when and how to use them
– Pitfalls and watch-outs with supply chain data
– Overview of advanced topics: Shiny, Quarto, and Markdown
The target audience for this course are data analysts and business analysts who are now, or moving into, a role supporting supply chain. However, anyone whose roles touch data viz in supply chain – product managers, data scientists, team leaders, and more – will find value in this course.
This is hands-on, technical training. Expect to spend a large part of the day working through code examples in supply chain data – with all the real-life data issues you’ve come to expect. Working familiarity with R (specifically the tidyverse packages) is necessary. We will suggest resources to those who would like to improve their familiarity before the course.
To ensure personal attention, we’re limiting this to 30 attendees, and we expect this to fill up fast. If you or your company has been thinking about using R for supply chain data, this is your chance to learn up-close!
Register here. Registration is $750/person for the day. 20% discount for organizations registering 5 or more participants. 10% discount for educators and military/veterans/military spouses (please email ralph@datadrivensupplychain.com after registering for discount).
Use your 2023 professional development dollars before it’s too late!
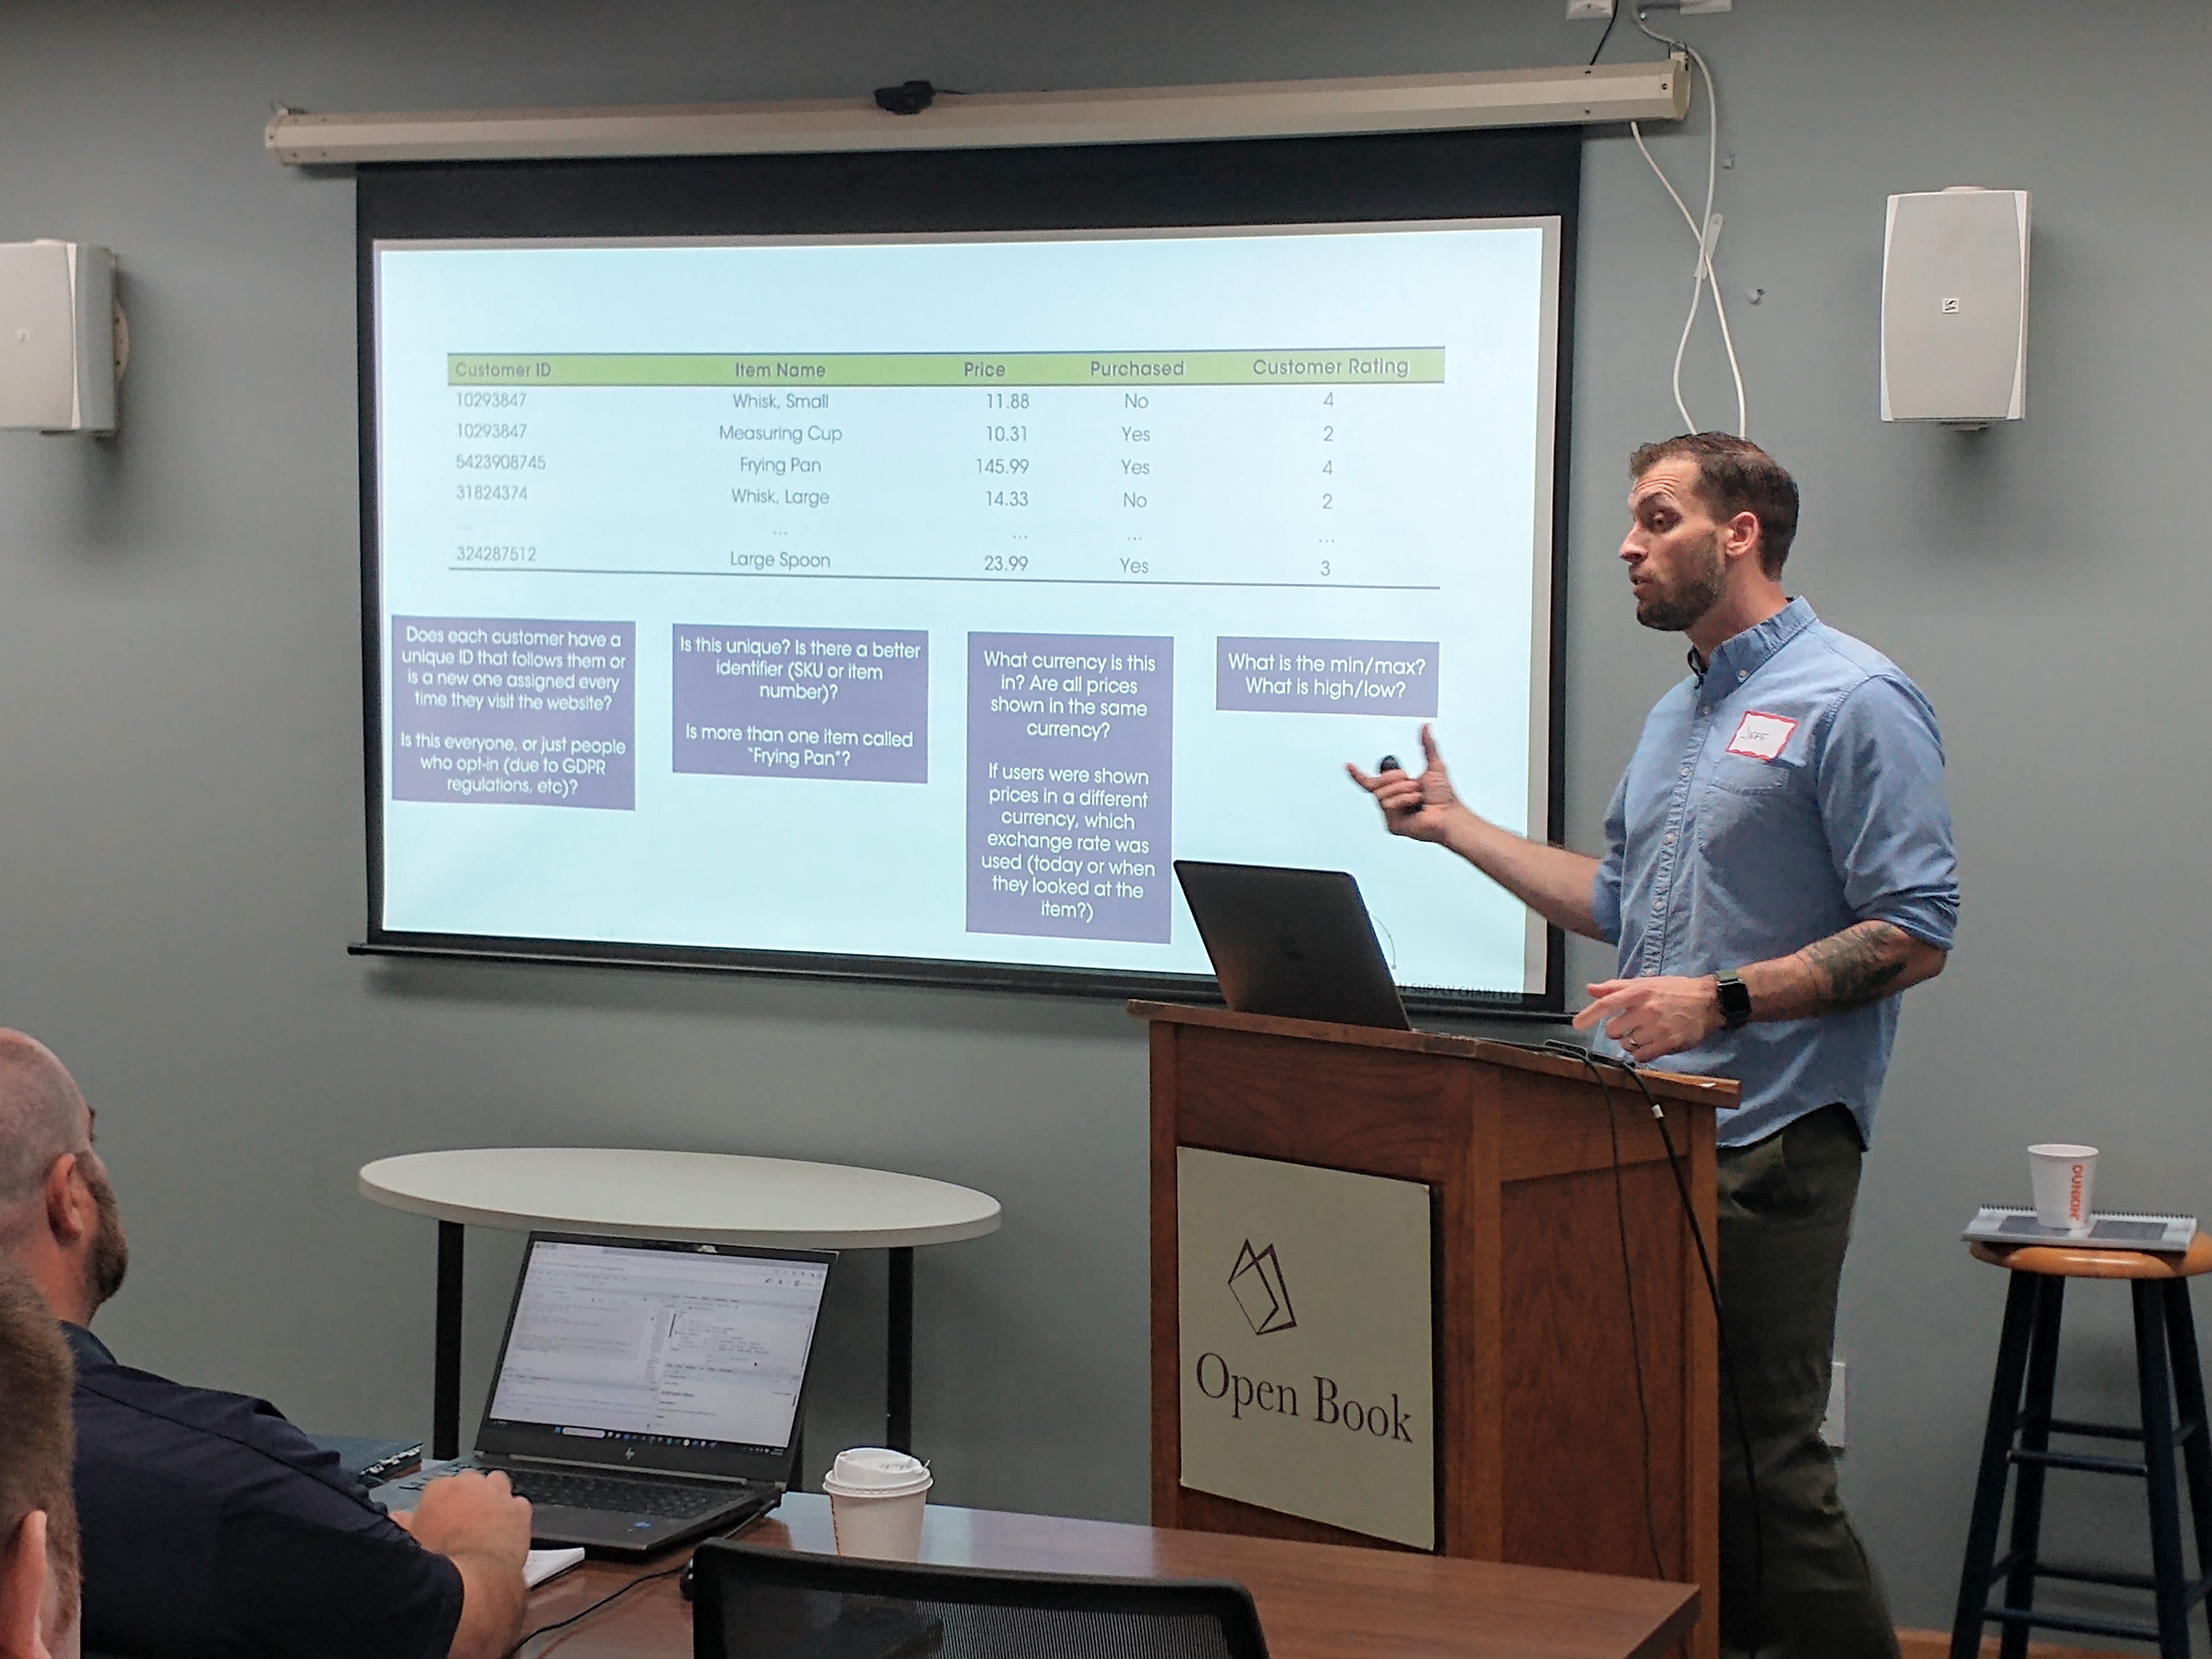
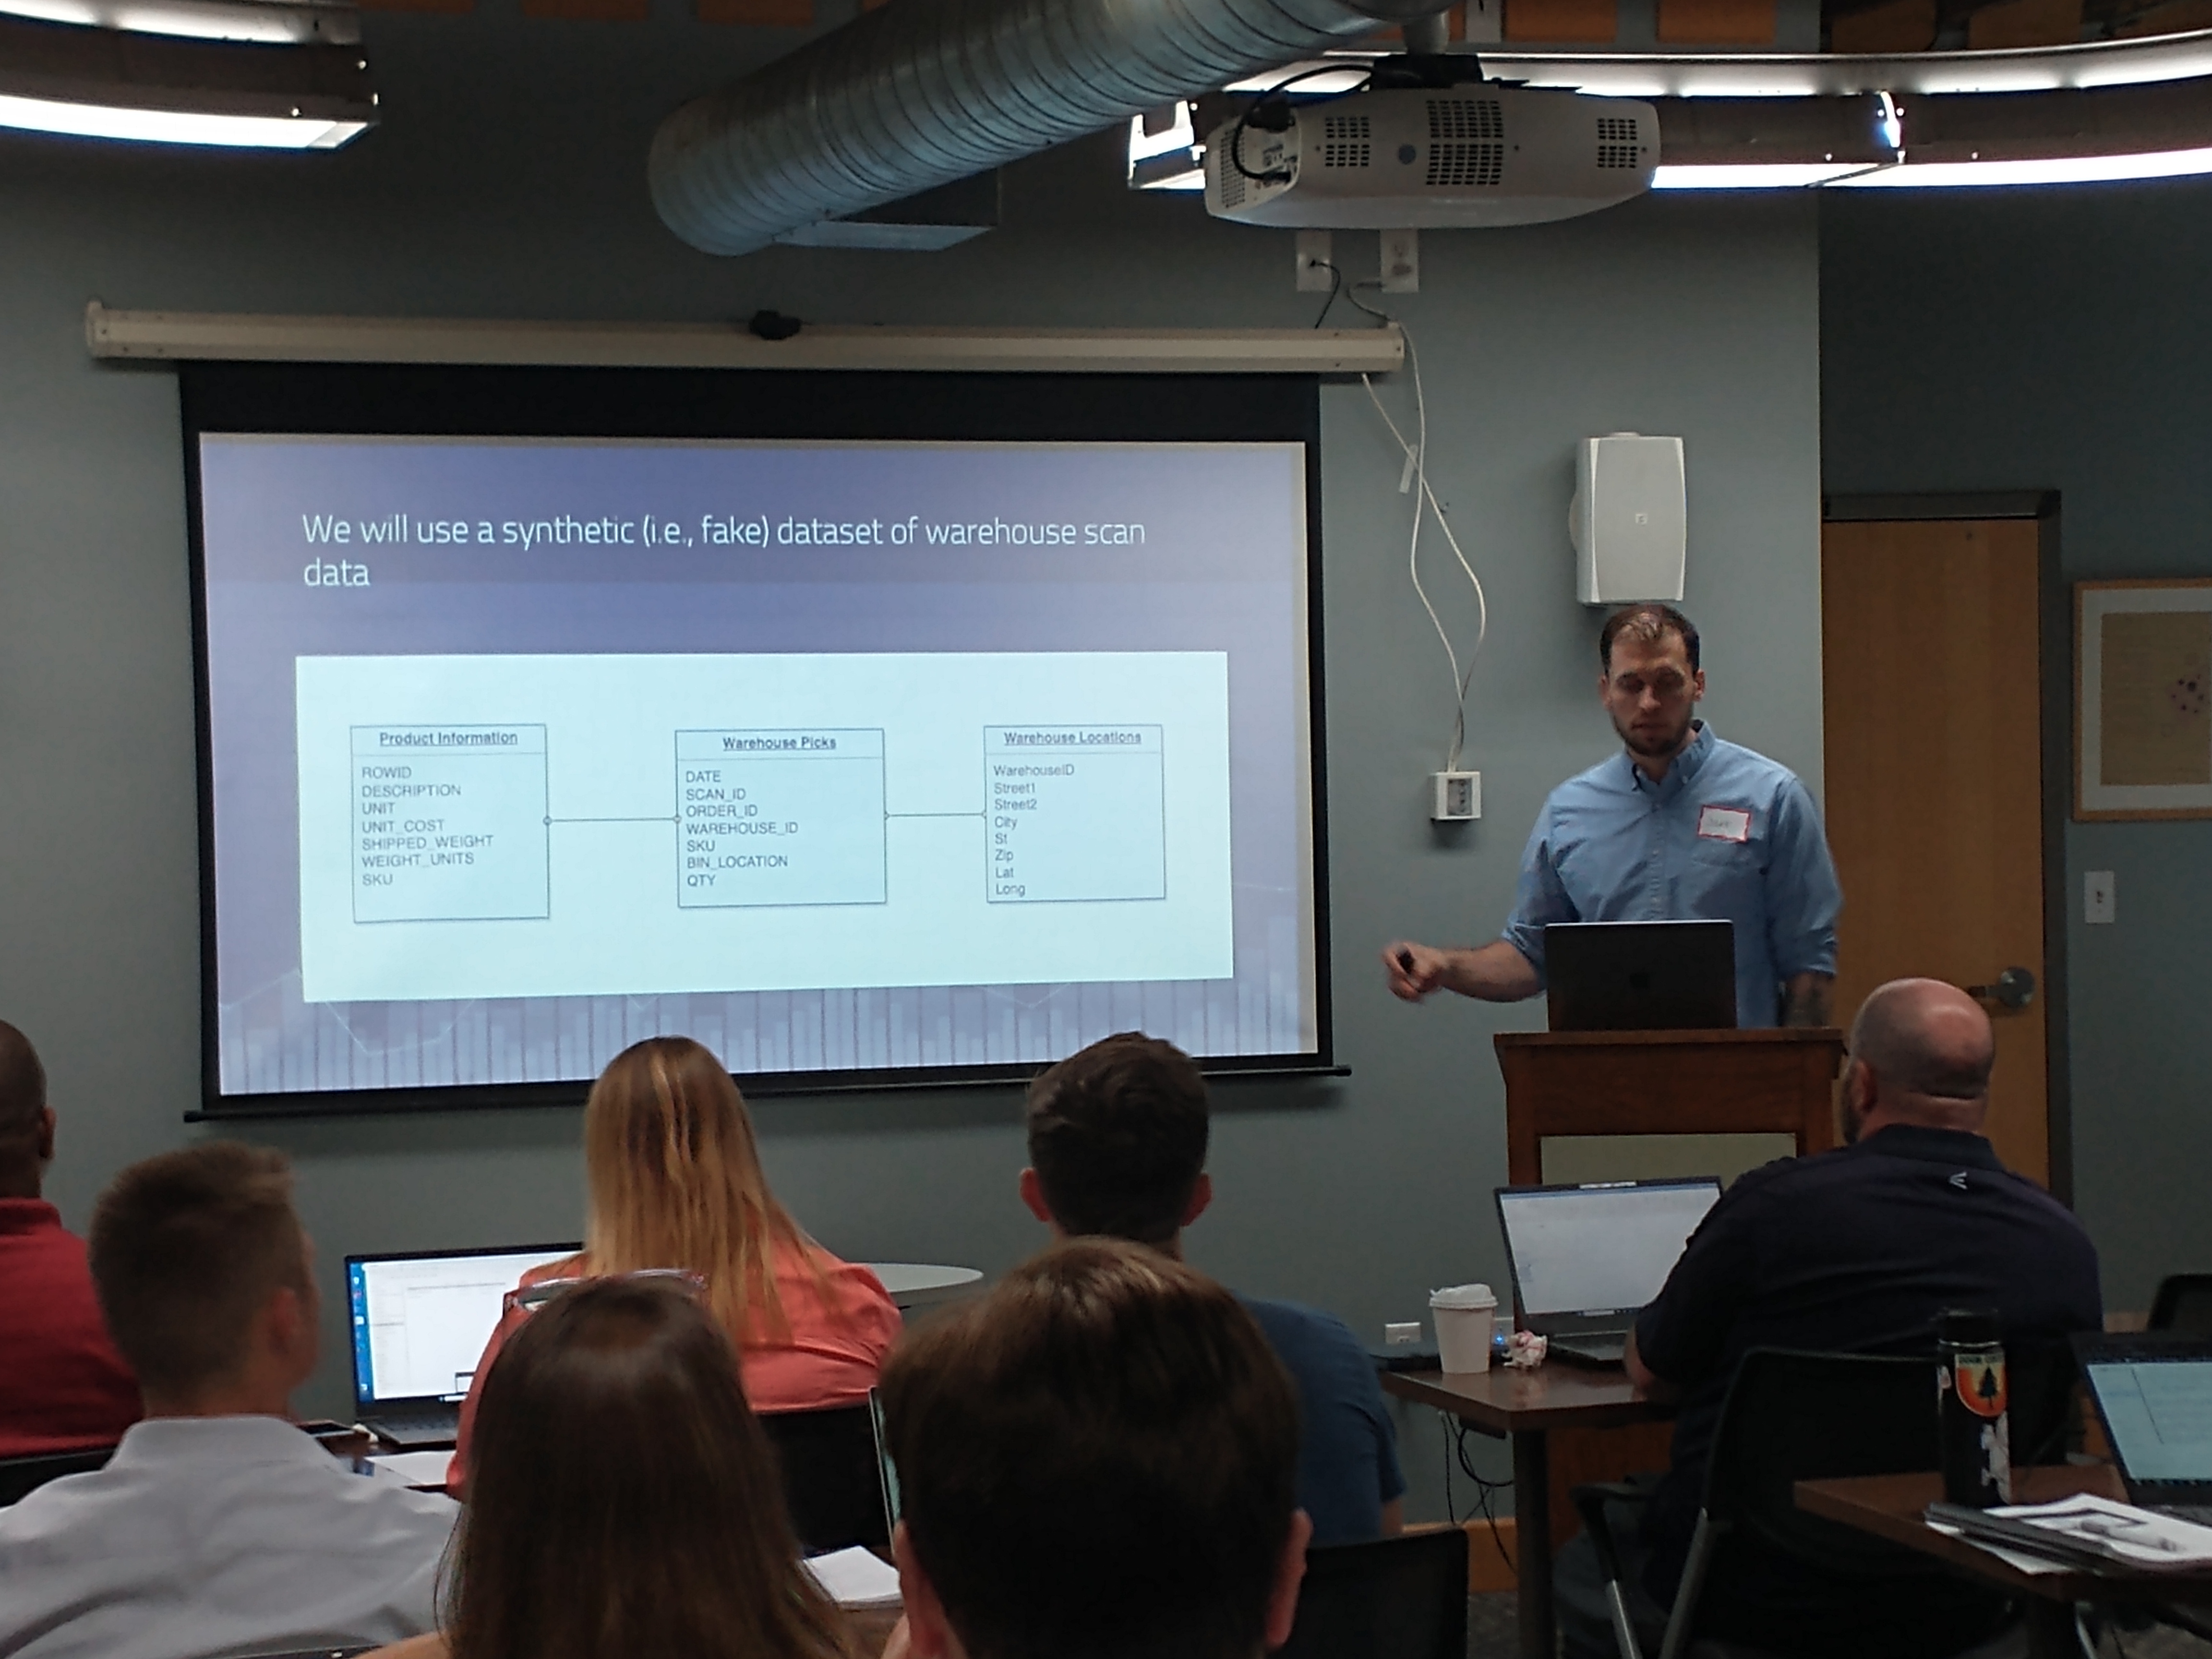
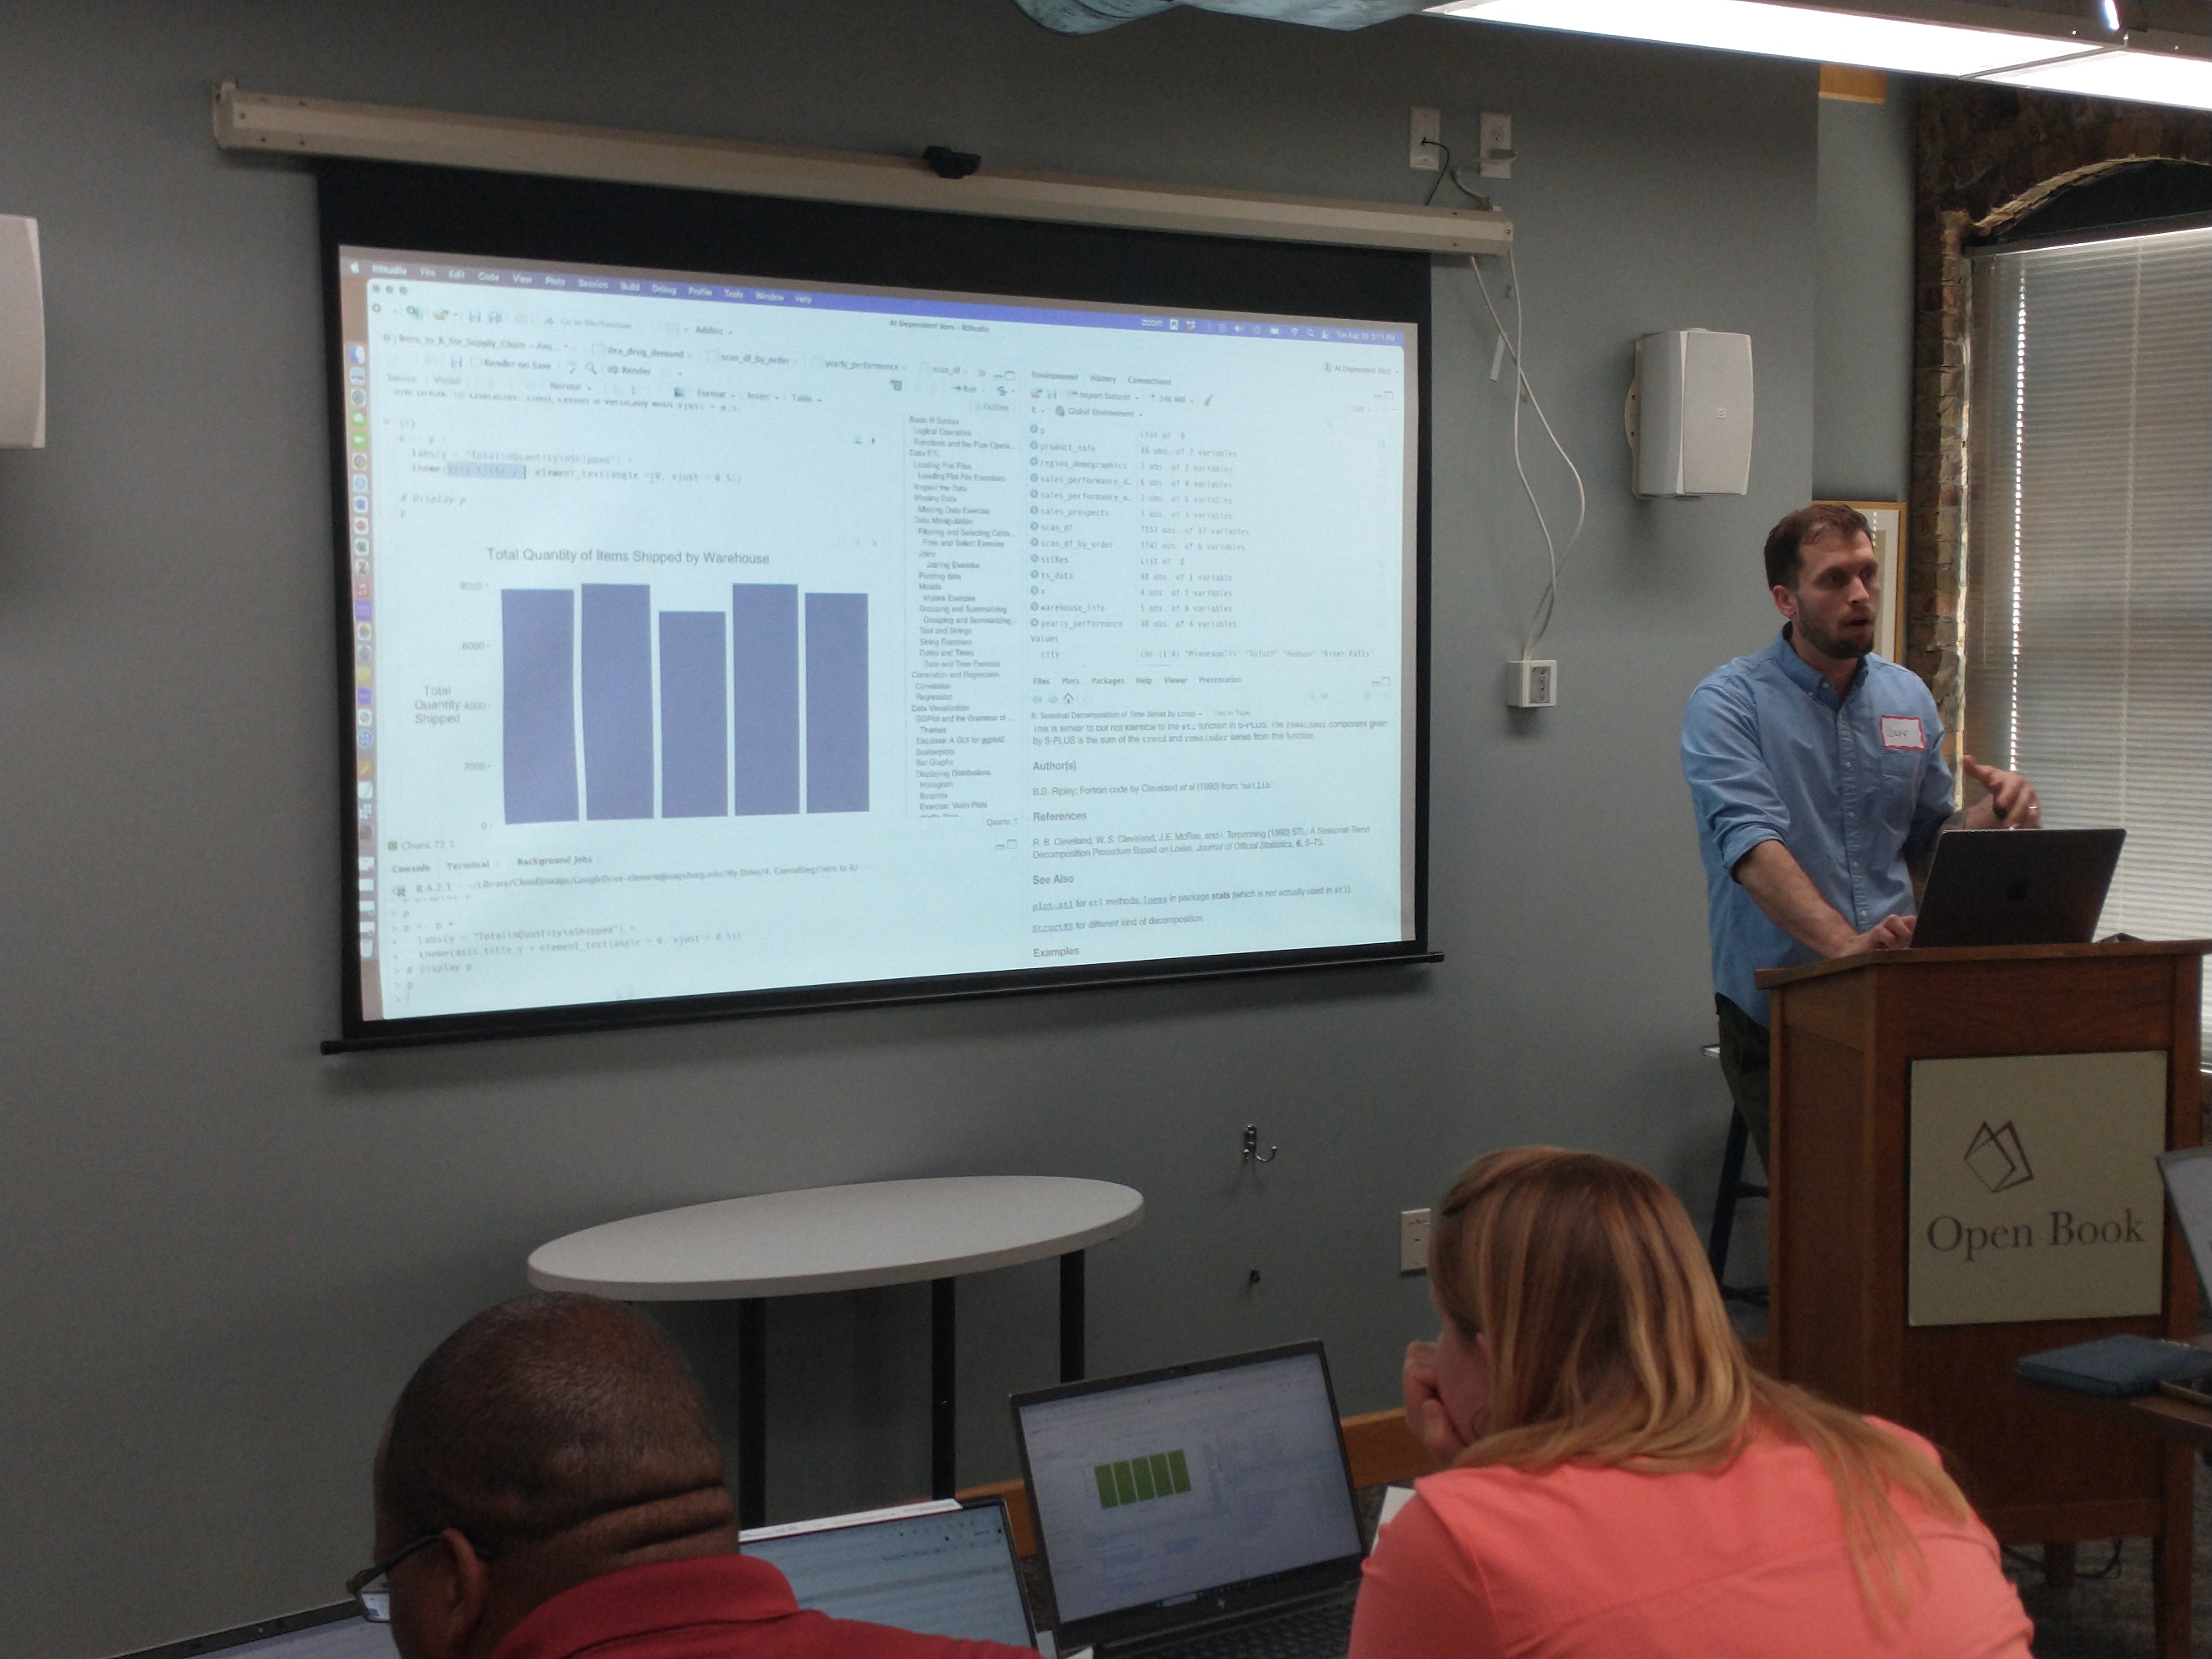
Images are from our August training in Minneapolis.